


Successful trading requires more than instinct or luck. Modern traders rely on technical analysis, a method that studies price charts and market data to forecast future price movements. At the core of this approach is the technical indicator, a powerful analytical tool that helps traders understand market behaviour, identify trends, and precisely time trade entries. These indicators are widely used across different types of shares, including large-cap, small-cap, growth, and dividend stocks.
This article explores how traders use a technical indicator to time entries, the main categories of indicators, and their importance in stock trading.
Understanding Technical Indicators
A technical indicator is a mathematical calculation based on historical price, volume, or open interest data. Traders use these calculations to interpret price patterns, detect trend changes, and identify favourable entry points. When used correctly, a technical indicator reduces emotional decision-making and improves trading consistency.
Technical indicators are generally classified into two categories. Leading indicators anticipate future price movements, while lagging indicators confirm trends after they begin. Both play an important role when analysing different types of shares, as each stock category behaves differently in the market.
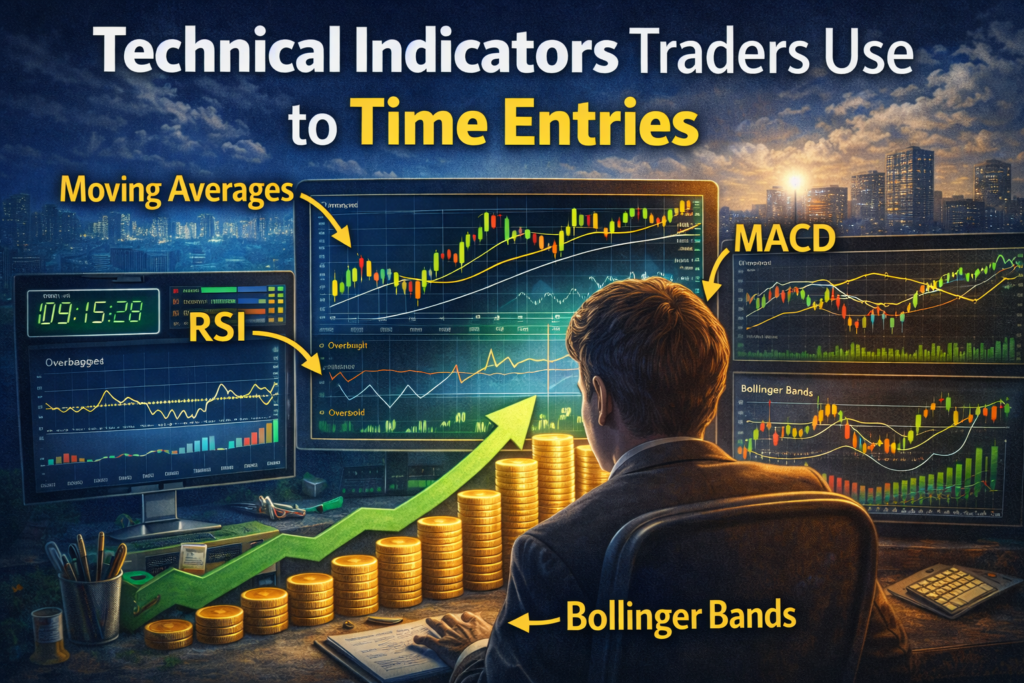
Types of Technical Indicators
Technical indicators can be broadly grouped into four categories based on their purpose and behaviour.
Trend Indicators
Trend indicators help traders identify the overall direction of price movement. They are most effective in trending markets and are widely applied across various types of shares.
Moving averages are among the most popular trend-based tools. Simple Moving Averages and Exponential Moving Averages smooth price data to highlight the prevailing trend. The Average Directional Index measures the strength of a trend, helping traders avoid weak or sideways markets. Parabolic SAR highlights potential reversal points and assists in timing entries and exits.
Momentum Indicators
Momentum indicators measure how fast a stock’s price is moving. These tools are especially useful for identifying overbought or oversold conditions.
The Relative Strength Index is one of the most widely used momentum-based technical indicator tools. It highlights potential buying opportunities below 30 and selling pressure above 70. The Stochastic Oscillator compares closing prices with price ranges to detect reversals. MACD combines momentum and trend analysis to signal possible entry points.
Momentum indicators are particularly useful when trading volatile types of shares, such as growth or small-cap stocks.
Volume Indicators
Volume indicators analyse the number of shares traded and help confirm price movements. Strong volume often signals genuine market interest.
On-Balance Volume tracks buying and selling pressure by linking volume with price changes. Chaikin Money Flow measures the intensity of accumulation or distribution. These indicators are valuable when trading large-cap and mid-cap types of shares, where institutional activity plays a major role.
Volatility Indicators
Volatility indicators measure the size and frequency of price fluctuations. They help traders identify high-probability entry zones during sharp market movements.
Bollinger Bands show price volatility using upper and lower bands around a moving average. Average True Range measures overall market volatility and helps traders plan entries and stop-loss levels. These indicators are commonly used for short-term trading strategies.
How Traders Use Technical Indicators to Time Entries
Timing entries correctly is crucial for profitability. A well-applied technical indicator helps traders enter trades with better precision and reduced risk.
Trend-Following Entry Strategies
Trend-following strategies rely on indicators such as moving averages, ADX, and Parabolic SAR. Traders often use multiple moving averages to identify crossover signals.
When a short-term moving average crosses above a long-term moving average during an uptrend, it signals potential buying momentum. This approach works well for growth-focused types of shares that show sustained directional movement.
Overbought and Oversold Entry Zones
Momentum-based technical indicator tools like RSI and the Stochastic Oscillator help traders identify price extremes. When RSI falls below 30, it may indicate an oversold condition and a possible entry opportunity. When RSI moves above 70, traders often wait for a pullback before entering.
This strategy is effective for both dividend-paying stocks and volatile types of shares, depending on market conditions.
Volume-Based Entry Confirmation
Volume indicators help confirm whether a price move is supported by strong market participation. Traders often use volume analysis to validate breakouts.
If a stock breaks a resistance level with rising OBV or CMF readings, it increases the probability of a successful entry. This method is especially useful when analysing large-cap types of shares influenced by institutional traders.
Volatility-Based Entry Opportunities
Volatility indicators assist traders in identifying sharp price swings. When prices touch the lower Bollinger Band during high volatility, traders may anticipate a rebound and look for entry opportunities.
Understanding which types of shares exhibit higher volatility is important. Small-cap and growth stocks generally respond better to volatility-based strategies than stable blue-chip stocks.
Combining Multiple Indicators for Better Accuracy
Professional traders rarely depend on a single technical indicator. Combining different indicators helps filter false signals and improves entry accuracy.
For example, traders may pair a trend indicator with a momentum indicator to confirm entries during strong trends. Volume indicators combined with volatility tools help assess the strength and sustainability of breakouts. This layered analysis is particularly important when trading unpredictable types of shares.
Backtesting and Risk Management
Even the most reliable technical indicator does not guarantee success. Traders often backtest strategies using historical data to evaluate performance under different market conditions.
Risk management techniques such as stop-loss orders and position sizing protect traders from unexpected losses. Effective trading combines technical analysis, disciplined execution, and strong risk control.
Conclusion
A technical indicator is an essential tool for traders aiming to time entries with precision. From identifying trends and momentum to analysing volume and volatility, these indicators provide structured insights into price movements. Different types of shares require different indicator combinations based on their behaviour and risk profile.
By mastering technical indicators, applying them strategically, and combining them with sound risk management, traders can significantly improve their entry timing, confidence, and long-term trading performance.


Leave a Reply