Delivering information in a visual format is always a better way of conveying. Out there are many data visualization techniques, but visualizing huge amounts of data has always been a challenge. With recent advancements in technology, many new ways of representing data have been evolved. One such way is visualizing data through Augmented reality. AR and Big Data have always complemented each other as AR requires huge data sets to render information on to a virtual or Real-time environment, which Big Data provides. In this paper, we explore briefly on some of the visualization techniques and detail about how Big Data can be visualized in Augmented reality environments.
What is Big Data ?
Data is an essential component and has always influenced human life, being stored for centuries. With the easy availability of the internet and increase the use of social media is enlarging the size of data being stored, thus creating the term Big Data. There are many different definitions for Big Data as it covers several areas and segments of the technological world. In a modest form, Huge sets of data measured in petabytes or exabytes used for analyzing and improving the living world is defined as Big Data. Most of such data is in the form of music, video, image and text format which is generated through social networks, cloud-based applications and from the public. Data sizes have been rapidly growing and are expected to even exceed zettabytes. International Data Corporation also states that such enormous data is shared and purchased by many organizations.
How Big Data is defined ?Big Data is defined based on the three V’s • Volume: Size of the data • Velocity: The speed with which the data is streamed requires it to be processed in an appropriate manner. • Variety: Numerous sources of data is available which may be structured, unstructured or both.
With the abundance of data, there also arises a need for processing data. There are many techniques which vary from novice to cutting-edge to process Big Data which have been derived from various fields of studies.
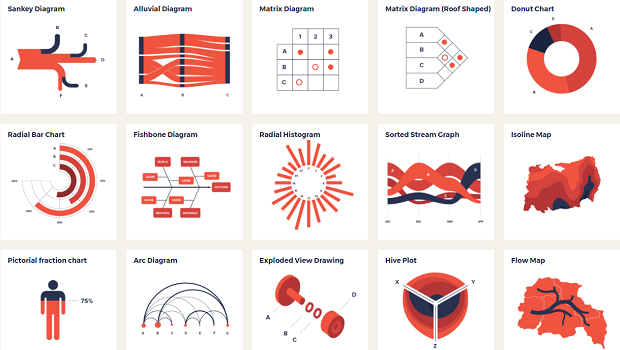
A Brief History of Data Visualization:Visualization methods were primarily developed in the 1980's called science and information visualizations, basically were three-dimensional visualization models. Successful visualization methods must consider subjective and perceptual properties of the human mind to enhance the experience and provide a coupled medium to interact with the huge amounts of data. Big data requires substantial visualization techniques to compare data at different reference points, extract patterns, improve interaction etc. Visualization methods have evolved a lot of over the past years with limitations beyond human imagination. It was in the 16th century when precise tools for data visualization were developed. They have been gradually making progress in the coming centuries as mathematical and statistical models evolved many new techniques for displaying ecological, census, economic and medical data were developed. In the current generation, the focus is more on interactive visualization techniques capable of handling large sizes of data and implement the graphics in 2D or 3D. These methods are mostly focused on representing the data on widescreen electronic devices. Some of the existing Data visualization methods are shown in the figure below.
Visualizing Big Data with Augmented Reality:
Big data visualization methods can be classified based on the type of data, the technique of visualization and compatibility. It is essential for Big Data to be translated as human thinking is constrained. The fundamental motivation behind present-day information visualization techniques revolves around images, figures, multi-dimensional animation etc.
What is the Augmented reality?
“AR allows the user to see the real world, with virtual objects superimposed upon or composited with the real world by supplementing reality, rather than completely replacing it.” Initial developments in AR have been since the 1960’s by Sutherland, but it has gained much attention in the last couple decades. An AR visualization is comprised of three main features. • Combination of the real and virtual world. • Real-time interaction. • Rendering content in 3 dimensions. With its interactive and preferable virtual content, AR has been prevalent in the recent days in fields like education, advertising, entertainment. It is estimated that as of 2017, a whopping 2.5 billion mobile AR applications are being used universally.
Big Data and Augmented reality?
Big Data and AR have a sensible relationship that makes them an ignition for a new strain of challenging application domain. AR has an ability to process, improve and visualize the information in an out of the box way without any external distractions by totally binding with the audience.AR applications require more data than any other visual applications to process and visualize it in the most interactive way. In addition to the application, specific data AR application also requires external data of the surroundings and the environment. As mentioned previously the source of big data for AR applications would be the zettabytes of data produced each day over the internet. The collaboration of AR and Big Data is now a major research point for many researchers and both provide a wider opportunity for innovation in the fields of data visualization. The potential opportunities for the collaboration provide intellectual applications and systems which provide personal suggestions, information analytics etc. to users and organizations. Any data must be analyzed to get the better results out of it and it is a serious task while working with large sets of data. Additionally, Big Data requires human-machine collaboration to input the data for analysis purposes. Prevailing collaboration helps in a better understanding of the data and it is feasible to extract some useful information from it.
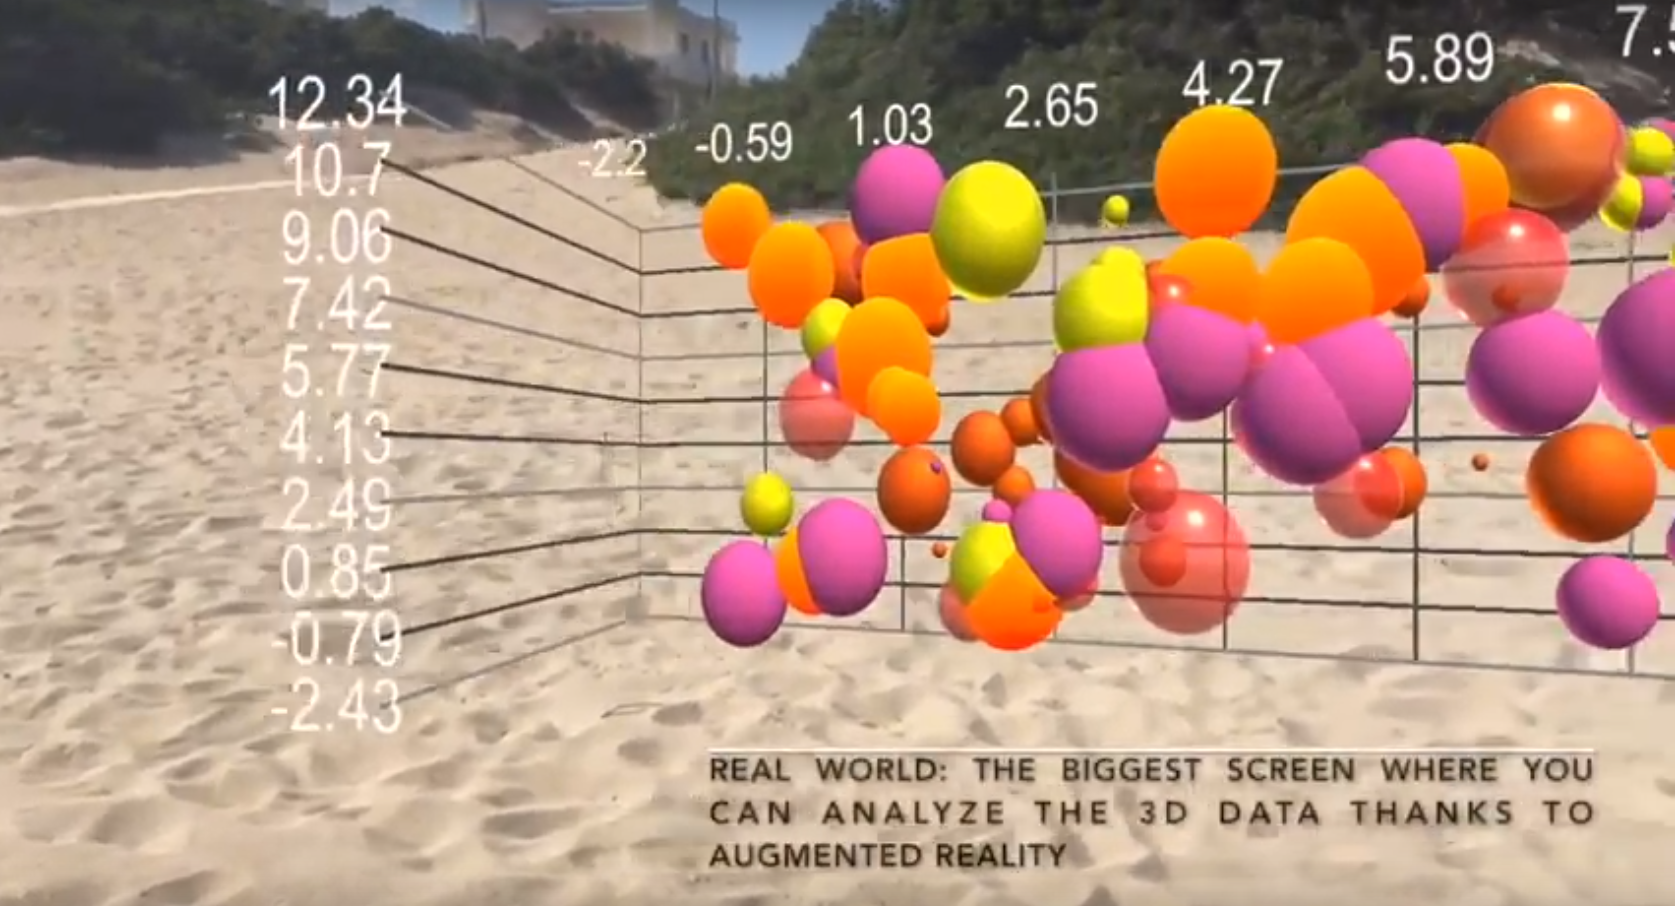
Even with many visualization techniques such as tables, graphs, 2D/3D modeling AR stands out on its own as the data visualization in its case in embedded in the real world to provide a greater insight from the data. For example, showing up a 3- dimensional building plan in the building site through an AR environment would be more appealing than a 2-dimensional plan on a sheet of paper or a screen which is a case of in situation visualization helping in workplace diagnosis. Big Data can be improved if an AR layer is added as AR empowers clients to be drenched in a whole new world blended with interactive information and their perspectives. Such data will be substantially more effortlessly comprehended if it relates original content and there doesn’t arise a necessity for interpretation of the data. It is necessary to be up to date even while rendering Big Data in the real-world environments with AR. Many applications specific and content specific requirements should be considered while doing so. Data must be processed and embedded into a real-time environment in a way that it should seamlessly fit into the environment. AR has a 3-dimensional visual interface which portrays the data without distracting the user far from reality.
Applications:
Augmented reality and Big Data have introduced new business rules. But not all the businesses are able to implement this collaborative visualization technique due to the inadequacy or limited data. Though there are only limited markets where this visualization is applicable, it is evident that it might go far beyond.
Medicine:
The need for information and instant processing of the dame is highly necessary in the field of medicine and healthcare. AR is being used in the healthcare industry for around 10 years. Large amounts of patient data are readily available which can be visualized to extract frequent ailments in an individual or a geographical area and can be used for medical education purposes. People have been using smartphones and other health and activity tracking devices which generate data on the go about the blood pressure, heart rate, cholesterol levels etc. All such information can be processed and AR can visualize them in an interactive way with real-time notifications. There is also a possibility where AR can predict the nutritional value of a meal just by scanning it through a mobile camera.
Retail:
Augmented Reality has also influenced the retail markets but is limited in some geographical areas. AR-enabled layers overlay information on the existing screen by taking the environment into consideration In the United States IKEA is one of the retailers which has implemented AR into its mobile application which virtually places a furniture item in the customer's house or office to match the surroundings.
Tourism:
Tourism is another sector where AR is widely associated. Large data sets are generated from spatial exploration, GPS based tracking, analyzing trends from tweets or check-ins, surveys etc. which can be used to analyze and provide the customers with an interactive tour planner /guide. Geographical data is also being used to develop interactive 3-D maps for improved navigation systems.
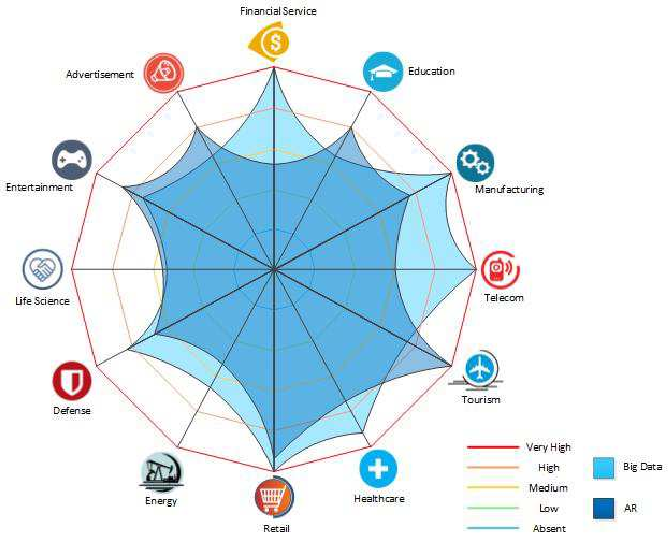
Further more the application fields of AR and Big Data are represented in a pictorial format in the below image.
Conclusion:
The concepts of Big Data and Augmented Reality are very new compared to other existing ones. Augmented reality is an immersive data experience providing platform offering a broader scale for visualization that holds large amounts of digital data without compromising on the detail. Ongoing research and development can only unleash the full potential of this technological convergence and to be a trendsetter.
About the Author: Ananth Iyer
The writer of this article is a Ph.D. Student & Graduate Teaching Assistant for the Department Of Computer Science at The University of North Dakota.Sources: [1] "Special Report: Big Data." IEEE - The Institute, theinstitute.ieee.org/static/special-report-big-data. [2] Olshannikova, Ekaterina, et al. "Visualizing Big Data with augmented and virtual reality: challenges and research agenda." Journal of Big Data 2.1 (2015): 22. [3] Ruan, Zichan, et al. "Visualization of big data security: a case study on the KDD99 cup data set." Digital Communications and Networks 3.4 (2017): 250-259. [4] Azuma, Ronald T. "A survey of augmented reality." Presence: Teleoperators & Virtual Environments 6.4 (1997): 355-385. [5] Bermejo, Carlos, et al. "When Augmented Reality meets Big Data." Distributed Computing Systems Workshops (ICDCSW), 2017 IEEE 37th International Conference on. IEEE, 2017.[6] "How Ikea is Using Augmented Reality." Digiday, 4 Oct. 2017, digiday.com/marketing/ikea-using-augmented-reality/. [6] "AR and Big Data: Interoperable Data Repositories for Collaborative Work Environments (CWEs)." YouTube, 5 Aug. 2016, [7] Top Big Data Companies in the world: https://www.softwaretestinghelp.com/big-data-companies/.









Leave a Reply